Description
We are building and refining a data dashboard for the California Community Colleges Foundation to make it easy for them to understand the effectiveness of their training materials.
Info
URL:: https://datastudio.google.com/u/0/reporting/ee21fc88-8b76-41ce-9291-319bf006a244/page/S3FiB
Previous
Tasks
Completed
- Consider options for presenting free response data. For example, maybe select question, then be able to sort or filter on response (e.g. “just show me the negative responses scored 1 or 2.”). Tasks ✅ 2022-02-03
- Ingest CSOD evaluation data into BigQuery Tasks ✅ 2022-02-03
- Set 30-day date range on both reports Tasks ✅ 2021-08-24
- Add a computed field to responses that returns the numeric value of a likert response (See Mappings) Tasks ✅ 2021-08-24
- Filter evaluation data by date range Tasks ✅ 2021-08-24
- Above the table of evaluation data responses, provide a summary for each question, with a bar chart histogram showing the number of responses for each Likert option as well as a weighted average Tasks ✅ 2021-08-20
- Confirm registrations and completions tables are being filtered Tasks ✅ 2021-08-20
- Create evaluation responses source Tasks ✅ 2021-08-19
https://cccpln.csod.com/services/api/x/odata/api/views/vw_rpt_eval_question_user_response_local?$select=equr_user_response_id,equr_user_response&$filter=culture_id%20eq%201
- Blend new data source with a data source containing responses and the training Tasks ✅ 2021-08-19
- Create joined source with evals and training Tasks ✅ 2021-08-18
- Evals: https://cccpln.csod.com/services/api/x/odata/api/views/vw_rpt_evaluations?$filter=eval_date_submitted%20ne%20null&$select=target_user_id,re_eval_lo_id,eval_id,eval_date_submitted,re_eval_question_user_response_id,eval_question_type,re_eval_question,eval_question_user_comment
- Training: https://cccpln.csod.com/services/api/x/odata/api/views/vw_rpt_training?$filter=lo_active%20eq%20%27Y%27%20and%20is_latest_training_version%20eq%20true%20and%20lo_provider%20eq%20%27California%20Community%20Colleges%27%20and%20lo_status%20ne%20%27DELE%27%20and%20%28lo_type%20eq%20%27Online%20Class%27%20or%20lo_type%20eq%20%27Material%27%20or%20lo_type%20eq%20%27Video%27%29&$select=lo_object_id,related_lo_id
- Add paging to join connector Tasks ✅ 2021-08-18
- Add paging to single endpoint connector Tasks ✅ 2021-08-09
Links
Resources
- CSOD API Paw project- Experiment with the API in Paw app
Current Progress
2022-06-05
Events engagement query:
SELECT vw_rpt_transcript.user_lo_reg_dt AS registration_date, vw_rpt_transcript.transc_user_id AS user_id
FROM cccco-metrics.csod_data.vw_rpt_transcript
LEFT JOIN cccco-metrics.csod_data.vw_rpt_training ON vw_rpt_training.lo_object_id = vw_rpt_transcript.transc_object_id
WHERE vw_rpt_training.lo_provider = "California Community Colleges"
AND vw_rpt_training.lo_title is not NULL
AND vw_rpt_training.lo_type = 'Session'
AND vw_rpt_training.lo_location_id IN (187266, 124460)
2022-05-27
BigQuery ingestion
Ingestion is working except for one endpoint that is too large to fetch in a single Google Cloud Function timeout. Working on paging for that.
endpointsis now an array of objects- Each object has
urlandresultsPerPageproperties - The
resultsPerPageproperty is optional and will trigger paging - If an endpoint has
resultsPerPage, that endpoint will be fetched along with a count, and its$topparameter will be set to theresultsPerPagevalue - After the first result set is fetched for an endpoint with a
resultsPerPagevalue, check to see if we fetched all the records - If not, add a new endpoint onto the
endpointsarray that will fetch the next page of results- Does it need to be added after the first page, or can it just be appended?
- Since the current endpoint being fetched as shifted off the array, the next page could be added back to the front of the array to group all pages of a single endpoint together
2022-03-24
Community Membership
- We get back 5.5 million records from the
connect_community_usersendpoint - Each user is joined to each community
- Posted a question on the “Ask an Expert: Edge” community in the Cornerstone Success Center
- Dave asked that the same question be relayed to the client’s CSOD support
Communications Page
- We don’t have access to any of the data needed for this page right now
- Campaign name, email name, open count, and follow (link click) count are being captured on the VRC (proper, not public site) Google Analytics | Data | GA column | | ------------- | ------------------------------- | | campaign name | campaign | | email name | source | | open count | email opens (custom metric 1) | | follow count | email follows (custom metric 2) |
- VRC GA is a Universal Analytics property
- Universal Analytics custom metrics are not exposed in Google Data Studio
- We will recommend client update this property to GA4
- Not sure if UA custom metrics translate directly into GA4 metrics or if we will need to update email tracking to track open count and follow count to custom metrics
Learning Engagement
- Can get all data on LO, playlist, and curricula registration from the transcript endpoint
- Requires joining the data with training in order to determine what was registered for
- Relevant types are
Online Class,Material,Video,Curriculum,Playlist
Events Engagement
- Same as for Learning Engagement above, except the relevant type is
Eventor maybeSession
2022-03-07
Looking for endpoints that give me the data I need to get
Communities
- the users who currently have membership in one or more communities, both as a number and as a percentage of total users
- vw_rpt_connect_community_users
Learning (transcript)
- for the current period, the users who have registered for one or more Systemwide learning objects (provider: California Community Colleges), playlists (separately?), or curricula, both as a number and as a percentage of total users. If the selected period does not include today (or yesterday), do not show a value for percentage of total users.
- current (active) users who have ever registered for one or more learning objects, playlists, or curricula, both as a number and as a percentage of total users.
- LO registrations- vw_rpt_transcript
- playlist registrations- vw_rpt_training_playlist_follower
- Don’t have dates
- curricula registrations- vw_rpt_transcript_src_curriculum?
- Don’t have dates
Events (training)
- for the current period, the users who have registered for one or more Systemwide Events both as a number and as a percentage of total users.
2021-12-02
Got the three endpoints I needed syncing up to BQ every day at 2am (to offset from most daily operations which are refreshing at 3am). I also got those data sources into the single object report and added to the appropriate charts.
I messaged Dave Brown with a couple of questions on how to move forward.
- Should responses table show only responses with freeform responses and hide those without?
- Non-likert questions show freeform responses in the standard “Responses” column instead of in the “Freeform” column. How to handle? Exclude non-likert? Try to normalize?
I also described to him what appeared to be a discrepency in the data but actually makes perfect sense once I understood what was happening.
Also, one quick note that may help you avoid some confusion I experienced. You’ll notice that, for example, if you filter to the question “Please rate your overall satisfaction with this module,” the responses count is 3,000, but the responses table shows only 15 responses. The table shows only unique responses, so most of those 3,000 probably answered either “Satisfied,” “Dissatisfied,” or “Neither” without giving a freeform response causing all of their responses to be collapsed into those three rows. In those cases, I think it makes sense to filter out any rows without a freeform response, but that won’t work on the other style of question since the freeform response is the response.
2021-11-30
The function is deploying now. Fixed a number of smaller problems. I’m now getting the data and writing it to the temporary directory on the Firebase Functions instance. I get an error that appears to be from BigQuery: No schema specified on job or table.
Need to figure out what this means to move forward. I thought this file method of loading came with automatic schema, but that doesn’t appear to be the case.
2021-11-17
Revisited this today after a long break.
I’m still not able to push the data ingestion function to the new cccco-metrics project. Getting this error (that I didn’t discover until learning you can add a --debug option switch to a Firebase CLI command, which is not documented in the CLI’s help):
Error during upsert schedule for projects/cccco-metrics/locations/us-central1/functions/dumpCSODDataToBigQuery: Cloud resource location is not set for this project but scheduled functions require it. Please see this documentation for more details: https://firebase.google.com/docs/projects/locations.
I had inferred previously that the function was being deployed but that the cron task wasn’t being scheduled to fire it off by looking at the resources in Google Cloud. This confirms that.
When I pick back up, I will try to figure out how to set the resource location for the project. I hope this will resolve the issue.
2021-09-10
I have written a Firebase function and put in on a schedule to run every day at 2am. It was originally in the firebase-functions project which is otherwise functions for the demo system. I tested it there but started moving it to its own project on Firebase. The code for the project is at cccco-metrics/firebase.
I ended the day trying to get the Firebase project set up inside the local project with firebase use --add which was giving me Error: Server Error. connect ETIMEDOUT 104.197.85.31:443. I’ll need to revisit this first to push the code up so I can begin testing again. I have already removed the function from the demo system project.
The code is not working. The token request is generating a 400 error, and I’m not sure why. I tried logging out an error, which was helpful but also not exactly what I needed to see. I may need to call JSON.stringify on that error to get the most out of it before logging it out.
2021-08-24
Evaluation responses are too slow. Scot investigating using Google Sheets to cache the data blended the way we need. Sheets has no in-built method of importing data. Add-ons don’t have the features we need, so we would need to develop our own to get the data into Sheets.
At this point, we may be better off building our own method of getting the data into BigQuery since we can then remix the data however we want. Scot will check with Dave to see if he wants to build that out now.
2021-08-20
Got the bar chart showing likert responses in. I added a filter since the entire question won’t fit under the chart. Working on an average score for the questions by way of a calculated field to adapt the likert scores into numeric values.
Discussed these mappings with Dave Brown and he agreed.
Mappings
1
- Strongly Disagree
- Very Dissatisfied
- Not Confident
- Poor
- Not Applicable
2
- Disagree
- Dissatisfied
- Slightly Confident
- Below Average
- Slightly Applicable
3
- Neither
- Neutral
- Confident
- Applicable
4
- Agree
- Satisfied
- Fairly Confident
- Above Average
- Fairly Applicable
5
- Strongly Agree
- Very Satisfied
- Very Confident
- Excellent
- Very Applicable
null will be calculated at 2.5
2021-08-18
I got the data source created that will allow me to pull out the evaluation responses, but I can’t create the extracted source from it. We create an extracted source from each source to cache the data for a day and pull updates at 3am. The extracted source apparently adds enough overhead to force a timeout before the pull has completed.
Scot Muncaster is taking a look to see if he can figure out a solution.
2021-08-13
Got the join connector up and running with paging. I was able to create a data source with the evaluations + training too. Now, I just need to blend that with evaluation responses in the Data Studio front-end.
2021-08-10
Troubleshooting a problem with the join connector after adding paging. It’s trying to use the third endpoint even though I haven’t entered a value there. I reworked the current version of the connector so that it doesn’t require 3 endpoints and will work with 2. After pushing the first time and looking at executions, I realized I was pushing to the old deployment (appended with -delete), so I switched the ID over to the new one in .clasp.json.
It now pushes to the correct one – I can see the new code when I look at the project in Google Apps Script – but when I run npm run try_latest, it still launches the old one. That ID is no longer in the .clasp.json, so I don’t understand why it’s doing that.
2021-08-09
Got paging in on the single-endpoint CSOD reporting data source. Got it mostly in on the join connector but didn’t have time to confirm it.
2021-08-03
Continued working on getting the evaluation responses connector to work. It’s timing out because there are so many records. I added some logging and learned that it’s timing out before it even finishes de-duplicating. I had done some optimizations on the join algorithm, but we didn’t even get that far before timing out.
I also changed the runtime to V8, and it didn’t make any difference that I could observe. Will try blending in the UI instead.
Even getting the fields I need on the evaluations is going to be impossible without paging. The response is 80MB. I’m going to need to page it, but then will I have enough time before the timeout to join? Not sure that I will.
Scot has suggested trying to parameterize the data source and fetch only that learning object’s evaluation data. Will look into this and try it next time.
2021-07-31
The new connector I wrote had not been working because it didn’t have the credentials for the CSOD API set in script properties. Once I got that fixed, set up the data source, and tried to explore it, the connector timed out fetching the data.
I added some logging to the script to see where the 6 minutes (see Limitations) is being utilized, and I see that most of the time is spent fetching the 5+ million evaluation scores.
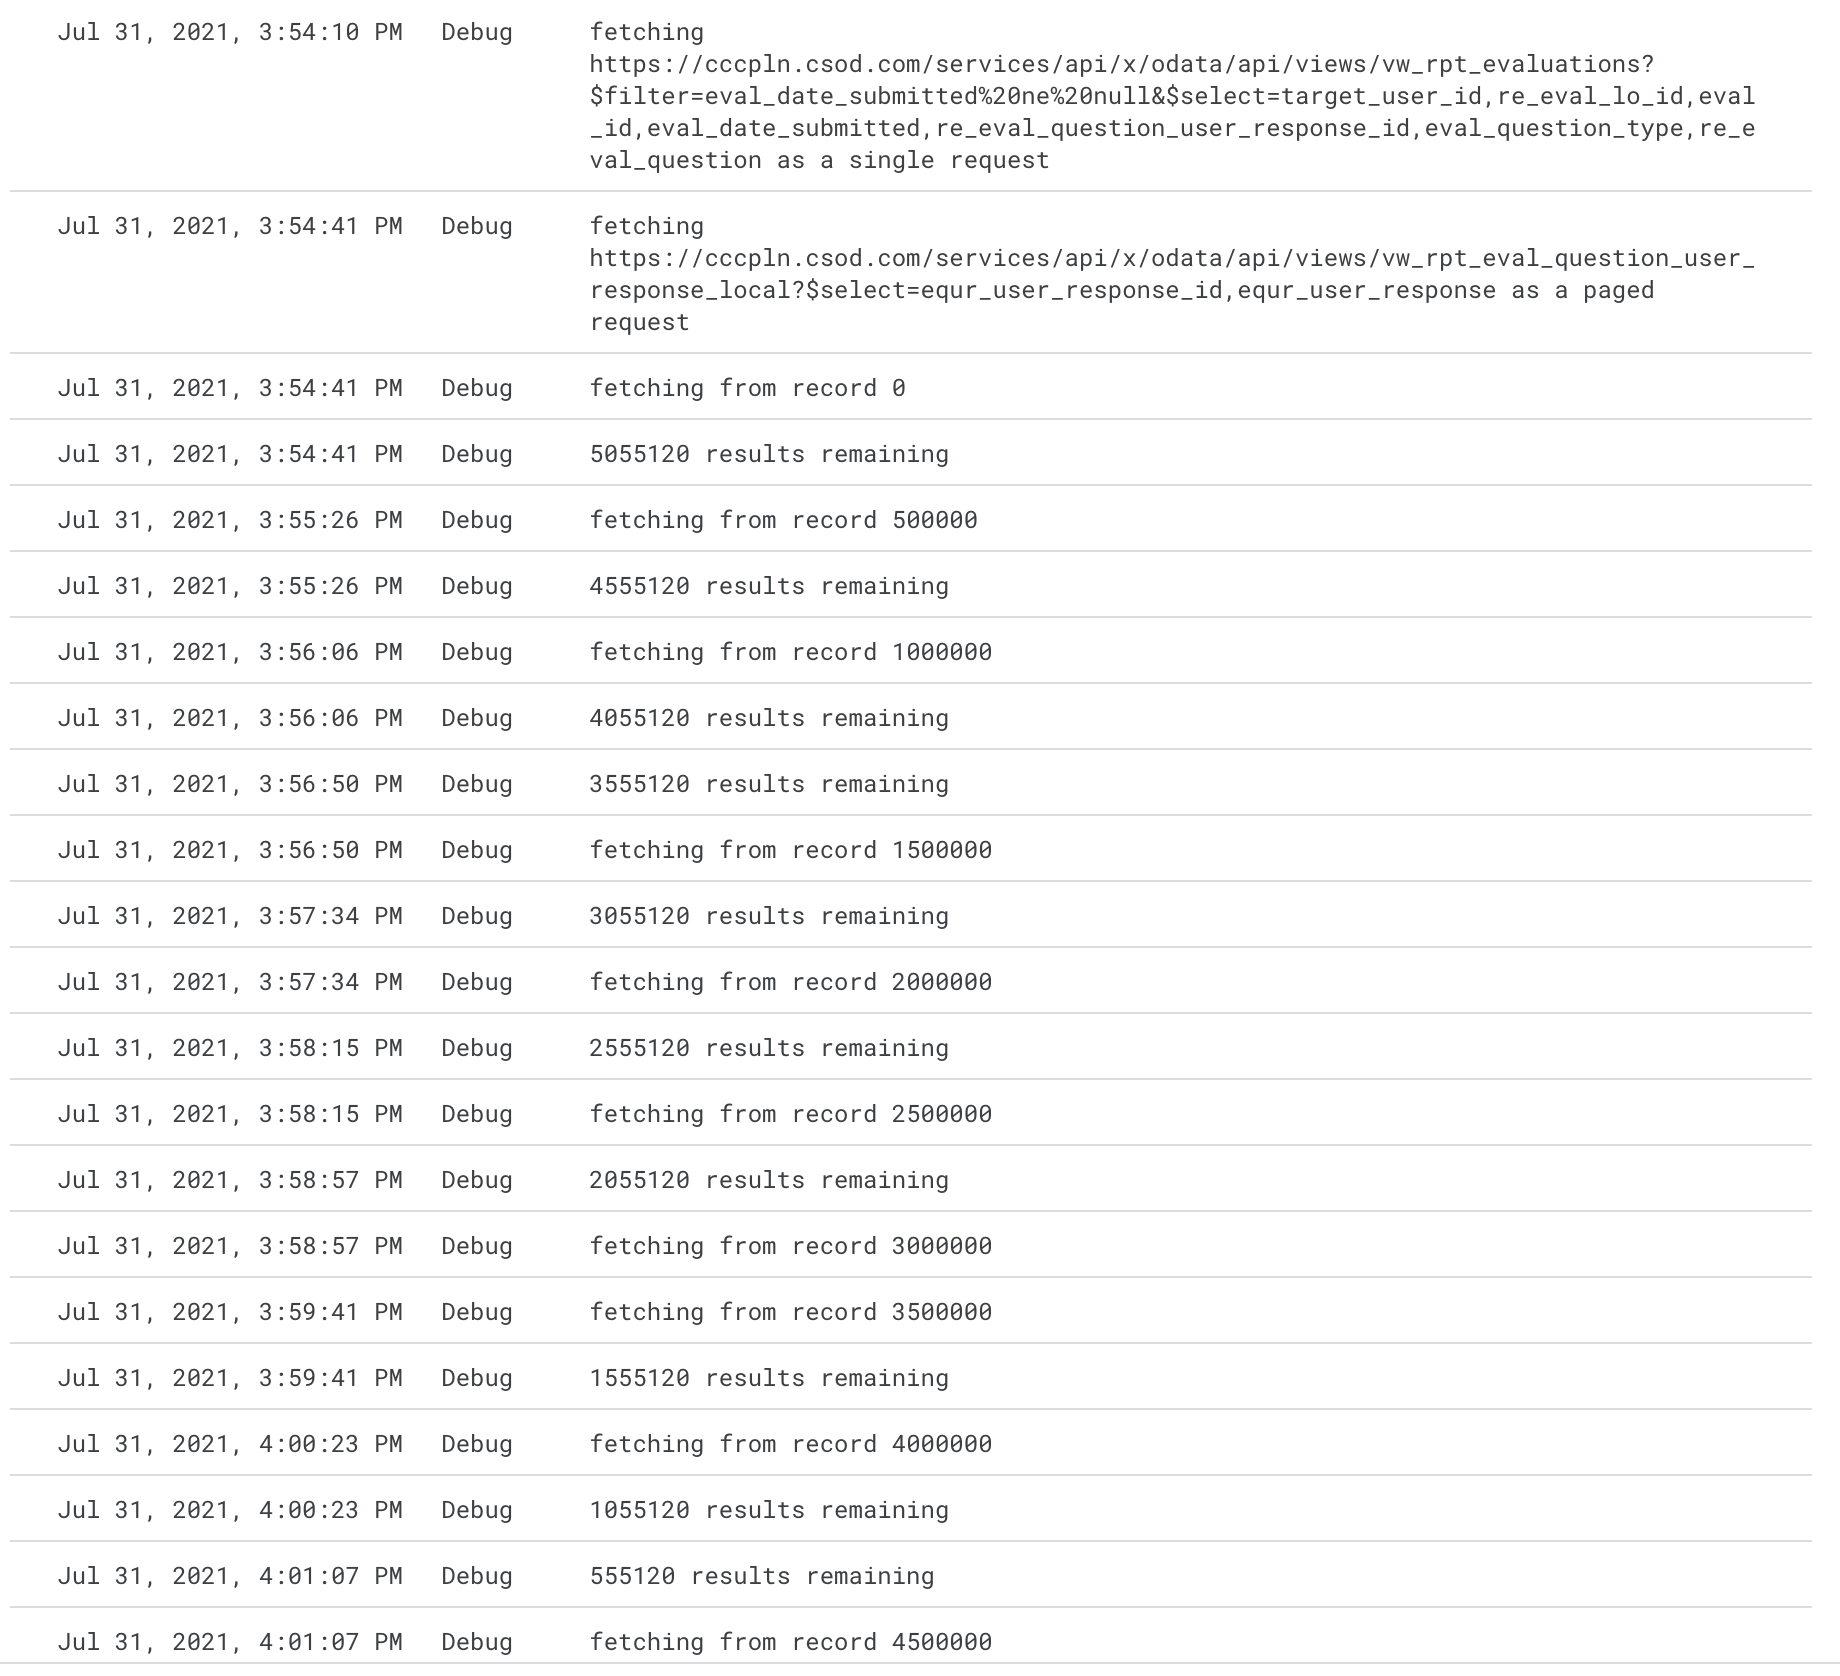
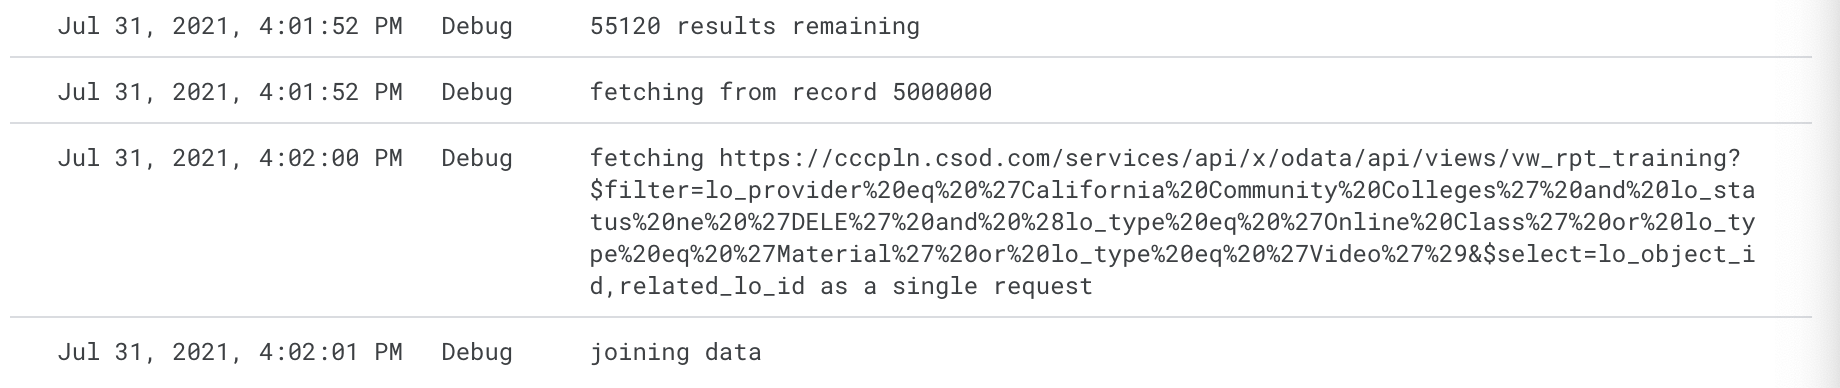
In actuality, the script runs for about 8 minutes, and 7:20 of that was devoted to the paged evaluation score requests.
The paging has to happen the stay under the limitation on response size. I’m not sure we could make it much faster as a single request anyway.
We could think about pulling this data into BigQuery so that we could pull the data from there. That would require us to write a plugin to pull the data. Based on my read of the pricing, we wouldn’t incur any fees to store and query this data.
“Processing” which includes querying costs $5/month per TB with the first TB free. This dataset is 75MB in JSON. We can use the caching connector on the Data Studio side to ensure we only query this once per day for an estimated 2.25GB of queries per month (75MB x 30 days).
Storage is billed at $0.02 per GB with the first 10GB free. With only 75MB over 5,000,000 records, it’s likely going to be a long time before we run into this limitation.
These eat into our free allotments that could be allocated to other projects, internal or otherwise, so we may still want to charge them for the usage. Even so, the fees would be minimal. We could charge them $5/month and easily cover everything with tons of overhead.
2021-07-27
Create LO detail page Jira ticket
The last pieces of data I need in the single learning object page are all related to evaluations. Built a connector for evalution responses in cccco-metrics/dm-csod-eval-responses-connector. Deployed it, but the configuration page in Google Data Studios when I run npm run try_latest never loads the configuration controls. It spins the spinner. Need to figure out why and fix the problem.
Help
Change CLI User
From the project directory, run ./set-dm-credentials.sh or ./set-radworks-credentials.sh to swap to the desired credentials for updating a production connector. Run ./reset-credentials.sh to swap back to the previous credentials.
Technologies
- Cornerstone OnDemand- The LMS used by the foundation for their content. We pull data from it to feed into the dashboard.
- Google Data Studio- Used to implement the dashboard